There is a great deal of discussion about the value of analytics and big data management in the technology industry today. Deloitte’s Center for the Edge has research called ‘The Big Shift’ that has looked at the changing world of global business. Among the research findings are points that suggest that with increasing globalization, lower barriers to entry, and the speed of communications, companies that can collect information, assess it, and act on it quicker than the competition may have some fundamental advantages in the marketplace.
On the other hand, some believe that information analysis is an important way to optimize a business but not as important in the early stage invention mode (I don’t agree with this at all). In his blog posting on KillerStartups, Bo Fishback, the CEO of Zaarly and previously the vice president of entrepreneurship for the Ewing Marion Kauffman Foundation, states that user testing and input trumps data at the early stage of the business.
My view is that information and data is only useful if it can help provide insights. Insights into both what customers/prospects want (for finding gaps and opportunities), what customers/prospects do (for optimizing), and what patterns are not obvious from raw data (for both finding gaps AND optimizing) are very important and can be the difference between leading and losing.
One of the challenges that I’ve run into is that analytics conjures up visions of statistics and complex mathematical equations. Both math and statistics are important to analytics but, with a well developed tool, those should be behind the scenes running the tool, not a required input into using the tool. A good data analytics tool should allow anyone on a startup team to be able to use it, it shouldn’t require a math major to be able to use it.
In my area of interest and research I come across a number of sites, services, and tools that may be interesting for startups. One of them is Tableau Software. Tableau is a Data Visualization tool that allows users to easily connect to datasets. From very simple flat data files (.csv, .xls, .txt) to very complex SQL data structures (Hadoop, SQL Server, Oracle, etc). Tableau can analyze data while the data stays in the repository or the data can be imported into Tableau for offline processing.

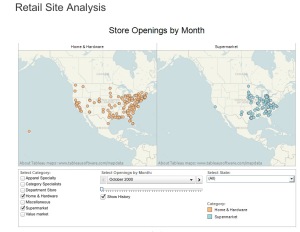
The main user interface for the user and the data is through a graphical management panel. Based on the data labels selected, different visual representations are automatically presented to the user to select. These visual representations are active graphs that allow for deeper understanding of the underlying data for the different objects. Things like mapping data to geographic map representations are quick and easy.
Why is Tableau interesting? Four main reasons; 1) it has a graphical interface that is ridiculously simple to use (easier than Excel for graph generation!), 2) it comes with a long library of data connectors and linking multiple databases is handled by Tableau – no complex SQL code to write, 3) it is fast and intuitive, this tool is appropriate for use across the organization, from a fresh marketing staffer to an experienced data analytics expert. and finally, 4) the price – it’s not expensive! (don’t tell them).
I was introduced to this tool during a Ph.D. course at Oklahoma State University where we are using it for some data mining. I’ve now used it extensively for other business analysis work and I’ve found that it has both saved time and provided useful insights by visually representing and allowing the manipulation of the visualization.
Tableau has a download of the tool available for trial.

One thought on “Tableau Software – a great tool for Data Visualization and Analytics for Startups”