Dedoose – providing context to qualitative research

One of the challenges that I have found over the years in my career has been getting technical (read engineering) people to accept and appreciate the value of qualitative research.

webBasedFullSize1

In marketing, customer feedback is a critical part of understanding what customers need and value.  Whether the feedback is around product features, advertising, customer satisfaction, messaging, or other important customer engagement areas, qualitative research plays a key role.

Technical people by nature tend to gravitate towards quantifiable data.  This is why surveys with Likert scales (e.g. 1-5 ratings) or numbers driven research (the volume of units or click data) is frequently favored by more quantitative minded people.  Part of this is because qualitative data is, by the very nature of the data, open to interpretation and easy to manipulate.  Regardless, while quantitative data provides the measure, qualitative data provides the flavor – it provides the deeper understanding behind the quantitative data.

Because of the challenge of presenting qualitative data to broader audiences, I’ve learned over the years to use several tricks to make this data more palatable.  Things like boiling down the data to the ‘Top 10 most common statements” or “This message was consistent among X number of focus group participants”.  This works in some cases but it still leaves a lot to be desired.

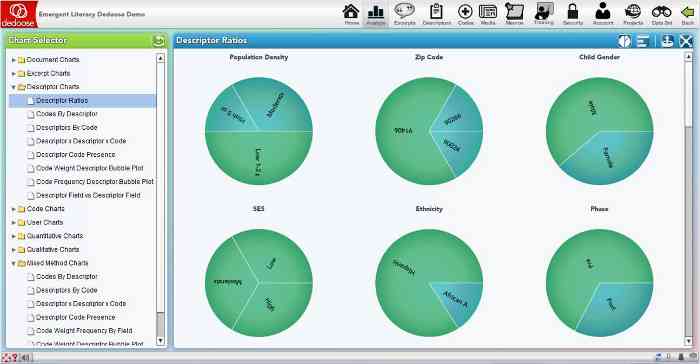
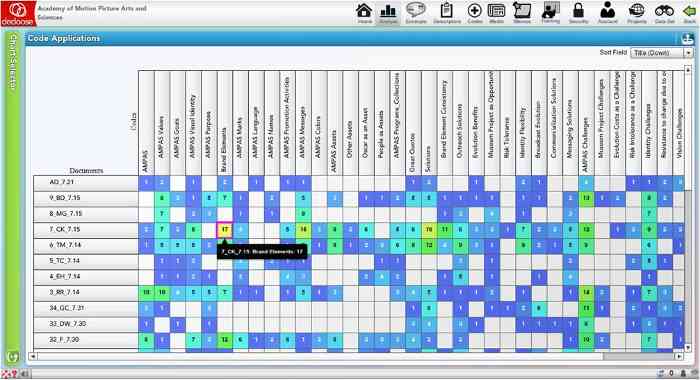
Enter a fantastic new tool called Dedoose.  Dedoose is an online research tool that can be used individual or in teams of researchers.  It allows for the management of qualitative data or mixed methods input (both qualitative and quantitative data).

Dedoose provides a structured way to code transcripts from customer interviews, focus group research, email or online responses (think customer service emails as research input!).  Based on the coding, the data can be manipulated and presented in ways that make it understandable and broadly usable.  Because of the workgroup capabilities, people outside the research team can be given access to the data for their own review and manipulation (dangerous, I know – but at least possible!).  WebBasedFullSize_2

One of the (many) nice things about Dedoose is that it’s easy and fun to use.  Our research group had several folks that were not computer or data oriented and they were able to immediately begin using Dedoose and contribute to our project.

Why is this such a powerful approach?  It allows marketing teams to conduct research using different methods and use the Dedoose platform to integrate them into usable, actionable data fast and accurately.  Spending time defending qualitative findings is non-productive time for marketing folks.  Tools that provide better integration, analysis, and presentation of qualitative data are invaluable in getting to the answer more quickly and getting organizational understanding more quickly.

Frequency-table

I have no direct relationship with Dedoose other than as a subscriber.  I’m using it in some of my academic research and it’s one of the new tools that I’ve come across that I believe provide real value for marketeers.

Descriptor-ratio-chart

http://www.dedoose.com

Rumors of the Death of the 4 P’s are Greatly Exaggerated

With all of the excitement of Social Media and Digital Marketing, there have been a lot of articles and commentary lately about the demise of the 4P model.  For those that don’t know or need a refresher, the 4P model stands for Product, Pricing, Placement, and Promotion.  A good, simple overview of the 4P model is presented on the NetMBA site.images

Ogilvy and Mather published an article about the 4Ps being out and the 4Es being in.  While I agree with the value of the 4E model as an extension or addition to the 4Ps (I have this as required reading in the undergraduate digital marketing course that I teach), it does not replace the 4P model.

There have been numerous attempts to EXTEND the 4P model over time.  There have also been arguments about what constitutes the main P’s with some arguing that People should be added (for customer segmentation).

Some argue that the 4Ps have been replaced by the 7Cs.  An alternative way of thinking about this is that the 4Ps approach the marketing mix from the vendor/producer viewpoint while the 7Cs approach marketing mix from the Customer/Consumer standpoint.  I think that this is another model that goes deeper and is complimentary to the 4P model.

As a way of highlighting the continuing importance of the 4P model, I point to the recent issues in the marketplace around Microsoft’s Surface RT tablet launch as a way of showing how critical the 4Ps really are to successful marketing.  Regardless of your personal viewpoint (Pro or Con) regarding the Surface RT platform, the product has had a challenging launch and ramp by any objective measure and it can be clearly tracked back to three of the four P’s.

From a Product standpoint, the Surface RT has had strong positive reviews for it’s industrial design but has also had negative responses to it’s lack of available apps and inability to run legacy Windows applications.

From a Pricing standpoint, there has been strong pushback from reviewers on the initial pricing for the Surface RT.  While there have been pros and cons about the Surface RT pricing and price positioning (with and without keyboards), the fact that it is raised as a value concern in various reviews shows that Pricing and price-positioning is an important part of the marketing mix.

Finally, Placement has been a major issue as the product was initially available only in Microsoft’s stores and online.  There was some commentary early on in the announcements that this was a point product for Microsoft and would not be available through broad distribution as a way to minimize competitive conflict with Windows 8 OEMS but that has proven to be an issue for the product’s acceptance in the marketplace.

From a Promotion standpoint, Microsoft has done a good job of building Awareness.  Using the 4P model it is possible to see clearly the challenges that they have in driving Consideration and, most importantly, Conversion.

While there is always value in extending models and creating complimentary models, the claims that the 4Ps are irrelevant are questionable at best.  Like good brands, good models stand the test of time.

Information Management in High Performance Learning Organizations

In 2009 the research team at the Deloitte Center for the Edge, led by John Hagel III, introduced a concept they titled ‘The Big Shift”.  Their research showed that competition was changing rapidly on a global basis and the current way of doing business was fundamentally broken.  They showed that return on assets (ROA) for public companies had declined by 75% since 19651.  They stated that The Big Shift “represents the convergence of long-term trends, playing out over decades, that are fundamentally reshaping the business landscape.”  A major trend that is reshaping the competitive landscape is around two powerful changes in the business world; digital infrastructure and knowledge flows.

The digital infrastructure is an interesting, well-known phenomena and I may cover this in a future blog post.  The more fundamental and critical shift is the change in knowledge flows.  Companies that can acquire information, interpret it, and take action faster than the competition may have significant competitive advantages.  In the new paradigm knowledge is an asset that should be nurtured, managed, and protected just like inventory, distribution networks, or cash.

What does this really mean from a tactical standpoint?  There is interesting research that breaks down information processing in a business context in a very meaningful way and provides a hierarchy of information management that can enhance knowledge creation and management in their organizations (Sinkula, James M, 1994)2.

The research breaks down the information processing to four key stages:

Information Acquisition – how and where does the organization get the necessary information;

Information Distribution – sharing information appropriately and in a timely way to facilitate action;

Information Interpretation (and resultant actions) – reviewing the information, drawing appropriate conclusions, and acting on the conclusions;

Organizational Memory – storing the information and the processes around the acquisition, distribution, and interpretation to enable consistent refreshing over time.

These four steps are inter-connected and absolutely critical in driving time-sensitive decisions that are fact-based, effective, and optimized for success.

If you subscribe to the Deloitte theory that Knowledge Flow is an asset to an organization then becoming world class at the first three stages is critical for competitive success.  The Organizational Memory component is critical for long-term value creation.

Each of these four stages are worthy of their own overviews and over the next few weeks I will be posting more about each of these areas.  I’d be interested in any questions or feedback on the above.

  1. Hagel, J., Seely Brown, J., and Davidson, Shaping Strategy in a World of Constant Disruption, Harvard Business Review, Oct. 2008.
  2. Sinkula, J. M., Market Information Processing and Organizational Learning, Journal of Marketing, Vol. 58, January 1994, p 35-45


Finding out what users REALLY do…

We’ve had endless debates internally about what customers want to do with our site and what works or doesn’t work with the layout of the pages. We have tried things that work in traditional marketing such as focus groups, surveys, analytics, etc. Unfortunately, what people tell you they WANT to do doesn’t always translate into what users REALLY do when they are on a site.

One of our eminent advisory board members (thanks Wendy) spoke to us several months ago about the importance of tools such as heat maps to see what goes on with the site. We finally found a great tool that is beginning to expose real issues and opportunities in building a site that users will really Heat Mapuse.

CrazyEgg (www.crazyegg.com) is a great tool that allows web site managers to visualize what users do when they visit your site. Heat maps tell you by color where clicks happen. Here is an example – this is a landing page for Antiques. What you’ll notice is that there is a tremendous amount of clicks on the search box and go button on the right, on The Gallery and My Home on the left, and nothing on the orange Take the Quick Tour button in the prime location in the middle! Obviously this is a page that we are going to redesign!

Another great feature is called Confetti – which gives you detail by click about what users do. They show things like time to click, operating system, browser type, search term, and other important facts about user behavior and profiles.

The best thing about CrazyEgg is the cost and the ease in implementing the tool. CrazyEgg starts at FREE and is priced based on need up to $49/mo. We are using one of the lower pricing tiers at iTaggit and it’s working great for us. The best part is that we can ramp up our pages and tests as we need to on demand.

Implementing the tool is easy. It’s a line of code on the page that needs to be watched. It took us an hour to implement the tool and immediately started to see results.Confetti

I’m not in the habit of trying to push someone else’s product, but this one is a great tool for any web marketer’s arsenal. Let me know if you find this tool useful. I’d also like to know if tips on tools like this is worthwhile too.

Web 2.0 challenges traditional marketing approaches

The traditional four P’s of marketing championed by Phil Kotler of Kellogg have been a cornerstone for many years. Product, Pricing, Placement, Promotion. At least TWO and maybe three of the P’s are much more difficult to manage given the changes driven by the internet and specifically Search Engine Optimization and Search Engine Marketing.

Pricing is not as straightforward and direct as it is for traditional bricks and mortar (and even web 1.0) businesses. There are multiple levels to get to the paying customer. The revenue is much more indirect than in any other business. For example, if a web 2.0 site is dependent on advertising revenue how do you control the ‘P – Price’? Yes, once you get to a certain size you can demand higher CPA or CPC rates, but you are still dependent on generating traffic to show the ads and even then your ability to drive the conversion rates necessary to recognize the revenue is semi-passive at best. And this is AFTER you have reached a traffic level where you can even set a price at all. Is this truly ‘Pricing’ in the traditional sense? Instead of focusing on the traditional levers of COGS (cost of goods sold), Gross Margin targets, and variable sales and marketing costs the web 2.0 marketeer has to focus on traffic, eCPC (effective CPC) rates, Click through rates, and ad priorities. And where the site actually generates direct revenue (such as subscriptions or premium features) there are additional metrics and drivers that the marketeer needs to focus on that are far outside the realm of traditional marketing.

Placement also has a very different meaning in the web 2.0 world. There is no shelf space (relatively) with the exception of search engine rankings and banner advertising locations. Banner ad locations also present a challenging difference. Does Banner Ad location represent Placement or Promotion? A/B testing is so critical in web 2.0 marketing! Unlike traditional advertising A/B testing where the marketing professional is testing both creative and media in the web 2.0 world the marketeer is testing location (placement) on page, media, specific site results, and creative. All of this with very questionable and inconsistent metrics between different sites and tools.

So, what does this mean? In my mind we’re beginning to see a new paradigm develop. Marketing will be much more dependent on analysis of metrics such as click through rates, exit rates, and time on site. Rather than being able to run focus groups to find out what customers ‘want’ the web 2.0 marketeer is going to have to be able to do in-depth statistical analysis to understand how the customer ‘want’ is translated into actions and web development.

Deepak Jain, the Dean of Kellogg’s School of Management, has a Masters in Mathematics and Statistics and is a top professor of marketing. I had a class with him early on and he spoke about the increasing integration of math and statistics into the marketing process. I didn’t get it at the time because I was in a traditional business. Now I do. He’s right and it’s moving faster than even he suggested.

Are others finding similar things? I’d be interested in hearing your thoughts. We’re beginning to look for more quant-friendly marketing interns here. Are you? Mail me at daltounian@itaggit.com.